
Chapter 1: Genesis & Historical Evolution of the Electric Vehicle (1832–Present)
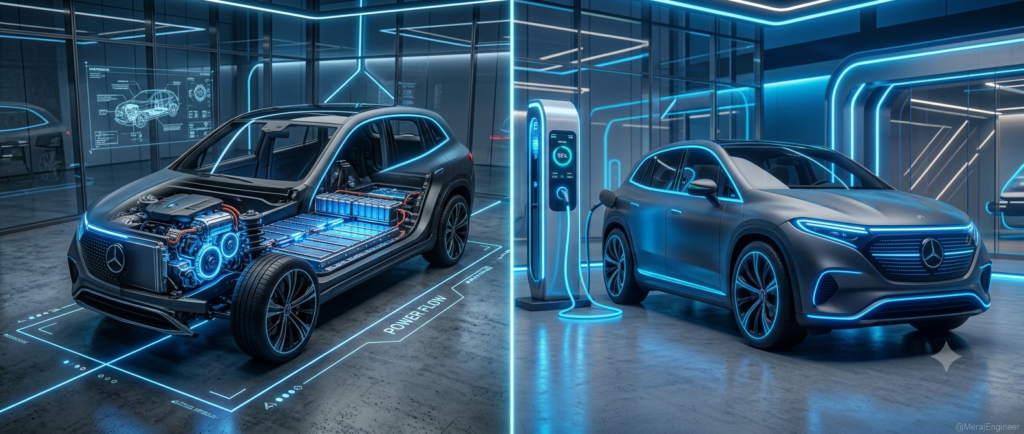
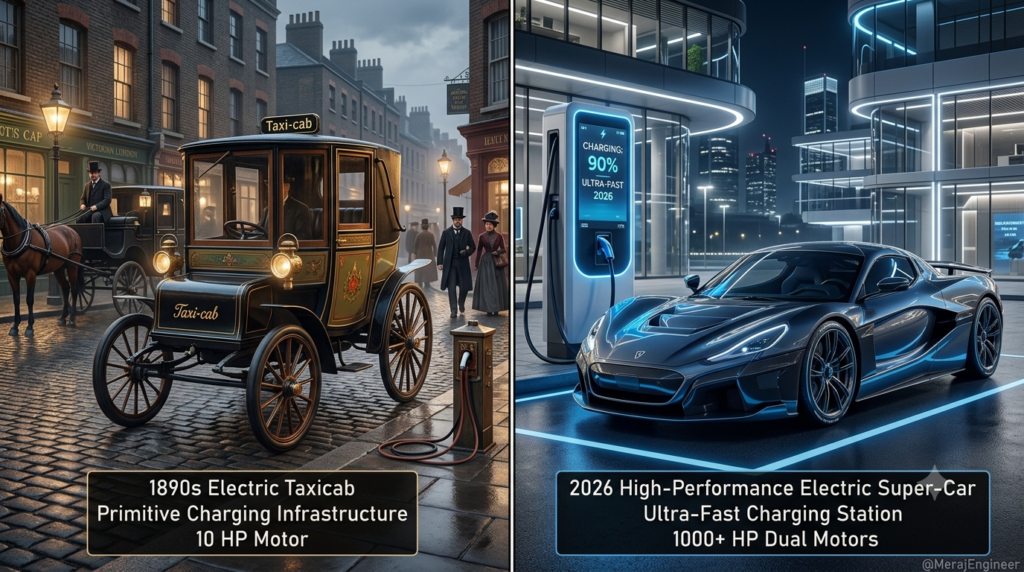
Electric Vehicle (e-mobility) is often mistakenly perceived as a 21st-century technological breakthrough. However, from an engineering perspective, electric propulsion predated the internal combustion engine (ICE) by several decades. Understanding this historical arc is crucial to evaluating modern automotive technology.
HISTORICAL TIMELINE OF EV PROPULSION
First Crude Carriage
Robert Anderson
Golden Era (38% Share)
Silent, No Crank Required
Gasoline Dominance
Ford Model T & Oil Boom
Modern Renaissance
GM EV1 & Toyota Prius
Li-Ion & AI Era
Tesla & Global OEMs
1. The Early Pioneers and Electrochemical Foundations (1832–1880s)
The transition from steam-powered mechanical contraptions to electric locomotion began with Scottish inventor Robert Anderson between 1832 and 1839. Anderson constructed the world’s first crude electric carriage, powered by non-rechargeable primary galvanic cells. While commercially unviable due to zinc-consumption costs, it proved electromagnetic propulsion was possible.
EARLY INNOVATIONS IN ELECTRIC TRACTION
Fabricated a small-scale electric motor operating on a miniature circular track, laying the foundation for direct current (DC) traction.
The game-changer occurred when he invented the rechargeable Lead-Acid Battery. This eliminated the requirement of replacing depleted chemical cells after a single run.
Improved battery efficiency and attached an electric powertrain to a three-wheeled English Coventry Tricycle, creating the first human-carrying rechargeable EV.
2. The Golden Era of Electric Vehicle (Mobility) 1890–1912
By the turn of the 20th century, electric vehicles dominated the nascent automotive landscape. In 1900, of the 4,192 cars produced in the United States:
US AUTOMOTIVE PRODUCTION BREAKDOWN
Electric vehicles gained rapid traction due to significant engineering advantages over early ICE engines:
🛠️ Key Historical Milestone: In 1899, Belgian engineer Camille Jenatzy set a world land speed record of 105.88 km/h in his torpedo-shaped electric vehicle, La Jamais Contente, proving the performance superiority of electric torque over early internal combustion engines.
EARLY ADVANTAGES OF ELECTRIC VEHICLES OVER ICE
Zero Mechanical Complexity
ICE vehicles required dangerous manual hand-cranking to start, posing severe risks of fractured wrists. EVs required a simple switch.
Absence of Vibration & Emissions
Early petrol engines produced severe NVH (Noise, Vibration, and Harshness) alongside soot and oil leakage.
Gearless Operation
ICE cars required complex, unsynchronized manual transmissions. EVs provided instant torque through direct-drive electric motors.
3. The Collapse of Electric Mobility (1920–1990)
Despite early dominance, three critical economic and technological shifts drove electric vehicles to temporary extinction:
WHY GASOLINE OVERTOOK ELECTRIC IN THE 1900s
Charles Kettering invented the electric self-starter, eliminating manual cranking for petrol cars.
Henry Ford’s Model T dropped ICE car prices to ~$300, while custom electric cars cost upwards of $2,500.
Massive crude oil discoveries dramatically dropped fuel prices globally, while battery technology stalled due to the energy-density limitations of lead-acid chemistry.
4. The Modern Renaissance (1990s–Present)
THE REBIRTH OF ELECTRIC VEHICLES (1990–PRESENT)
Strict environmental mandates (such as California’s Zero Emission Vehicle mandate in 1990) forced major OEMs back into electric research. This led to GM launching the experimental EV1 (1996) and Toyota commercializing the Prius HEV (1997).
The ultimate turning point occurred in 2008 when Tesla Motors commercialized the Roadster using high-energy-density Lithium-Ion cylindrical batteries combined with advanced power electronics—forever shifting global automotive engineering away from fossil fuels.
🚗 Chapter 2: Core Architectural Classifications (BEV, PHEV, HEV, FCEV)
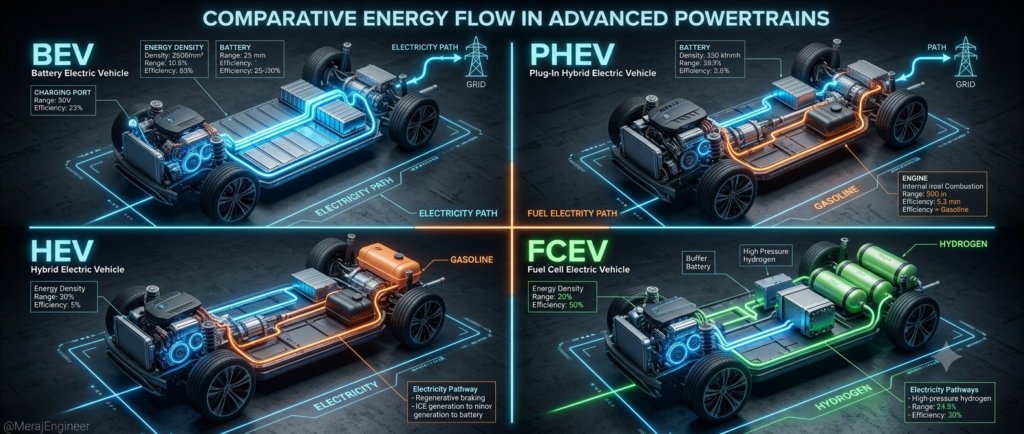
Modern electric mobility is divided into four distinct powertrain architectures. Each relies on different mechanical engineering principles, power management systems, and energy storage configurations.
POWERTRAIN ARCHITECTURE OVERVIEW
| BEV (Battery EV) | PHEV (Plug-in Hybrid) | HEV (Full Hybrid) | FCEV (Fuel Cell EV) |
|---|---|---|---|
|
• 100% Electric Drive • Grid Charging System • Zero Direct Emissions |
• Gas Engine + Electric • Medium Battery Pack • Dual Charging Options |
• Gas Engine Primary • Small Battery Buffer • Self-Charging Only |
• Hydrogen Fuel Cell • Chemical Conversion • Zero Emission (Water) |
1. Battery Electric Vehicle (BEV)
BATTERY ELECTRIC VEHICLE (BEV) OVERVIEW
Fully electric architecture with zero internal combustion engine components. Power flows exclusively from a high-voltage traction battery pack to an AC/DC electric motor via an inverter.
Battery Management System (BMS), Traction Inverter, On-Board Charger (OBC), Electric Motor (PMSM or AC Induction), Single-Speed Reduction Gearbox.
Grid Electric Energy ➔ Traction Battery ➔ Inverter (DC to AC) ➔ Motor ➔ Wheels
- Zero tailpipe emissions
- Lowest running cost per km
- Instant maximum torque
- Minimal moving parts (~20 vs ~2,000 in ICE)
- High initial acquisition cost
- Reliance on charging infrastructure
- Charging wait times
2. Plug-in Hybrid Electric Vehicle (PHEV)
PLUG-IN HYBRID ELECTRIC VEHICLE (PHEV) OVERVIEW
A dual-powertrain setup featuring an ICE alongside an electric motor and a medium-capacity traction battery (typically 10–25 kWh).
Can operate in pure EV mode for short distances (40–80 km). Once depleted, the system switches automatically to parallel or series hybrid mode using gasoline.
- Eliminates range anxiety entirely
- Allows zero-emission daily city commutes
- High mechanical complexity
- Carries weight and maintenance requirements of both petrol engine AND electric powertrain
3. Hybrid Electric Vehicle (HEV – Self-Charging)
FULL HYBRID ELECTRIC VEHICLE (HEV) OVERVIEW
Uses an ICE engine primary power source supported by a small electric battery (1–2 kWh). Cannot be plugged into an external charger.
Energy lost during deceleration is recaptured by turning the traction motor into a generator to charge the internal battery automatically.
- Higher fuel efficiency than standard ICE vehicles
- No external charging required (Self-charging)
- Cannot operate as a full long-range electric vehicle
- Still produces tailpipe carbon emissions
4. Fuel Cell Electric Vehicle (FCEV)
FUEL CELL ELECTRIC VEHICLE (FCEV) OVERVIEW
Uses compressed Hydrogen Gas (H2) mixed with atmospheric oxygen inside a fuel cell stack to generate electricity chemically on-board.
The only byproduct emitted from the tailpipe is Pure Water Vapor (H2O)—zero carbon or harmful gas emissions.
- Refueling takes just 3–5 minutes (similar to petrol/diesel)
- Long driving range without heavy battery weight
- Extremely scarce hydrogen refilling infrastructure
- High cost of green hydrogen production and transport
🔋 Chapter 3: Electrochemical Energy Storage Systems (Battery Tech, Chemistry, Safety & Thermal Management)
The heart of any electric vehicle is its High-Voltage Battery Pack. It accounts for 30%–40% of total vehicle cost and dictates range, safety, weight, and thermal performance.
MAIN EV BATTERY CHEMISTRIES COMPARISON
LFP
High Safety & Durability- Thermal Runaway: Starts @ ~270°C (Safer)
- Cycle Life: 3,000+ full cycles
- Energy Density: Moderate
- Highlights: Highly stable, Cobalt-free, lower cost
NMC
High Range & Performance- Thermal Runaway: Starts @ ~210°C
- Cycle Life: 1,000–1,500 full cycles
- Energy Density: High (Longer range)
- Highlights: Superior cold weather performance
1. Primary Lithium-Ion Chemistries in Electric Vehicle
A. LFP (Lithium Iron Phosphate – LiFePO4)
LFP (LITHIUM IRON PHOSPHATE) DEEP DIVE
Uses iron phosphate (FePO4) as the cathode material, eliminating reliance on scarce strategic metals.
- Extreme Thermal Stability: Resists thermal runaway up to ~270°C, making it structurally far safer against battery fires.
- Exceptional Cycle Life: Sustains 3,000 to 5,000 complete cycles before dropping to 80% capacity (translating to 500,000+ km lifespan).
- Cost & Sustainability: Contains no expensive Cobalt or Nickel, drastically lowering manufacturing costs.
- Lower gravimetric energy density (~140–180 Wh/kg), making battery packs heavier for the same range.
- Poorer discharge and charging performance in extreme sub-zero cold climates.
Tata Motors (Nexon.ev, Punch.ev), BYD (Blade Battery), Tesla (Standard Range Model 3 & Model Y).
B. NMC (Nickel Manganese Cobalt – LiNiMnCoO2)
NMC (NICKEL MANGANESE COBALT) DEEP DIVE
Uses a combination of Nickel (for high energy density), Manganese (for structural stability), and Cobalt (for energy efficiency and power delivery).
- High Energy Density: Reaches ~220–300 Wh/kg, allowing significantly longer driving ranges in a lighter physical footprint.
- Cold Weather Resilience: Maintains higher capacity efficiency and superior charge acceptance in freezing sub-zero ambient temperatures.
- Lower thermal runaway threshold (~210°C).
- Shorter cycle life (~1,000 to 1,500 cycles).
- Higher raw material manufacturing costs.
- Ethical sourcing concerns surrounding Cobalt supply chains.
High-performance & long-range EVs including Hyundai Ioniq 5, Kia EV6, BMW, and Mercedes-Benz.
2. Battery Thermal Management Systems (BTMS)
Batteries operate efficiently only within a strict thermal window (20°C to 40°C). Deviations cause severe range degradation or safety risks.
BTMS SAFETY LOOP ARCHITECTURE
Cuts traction battery connection immediately to prevent thermal propagation & electrical fires.
BTMS COOLING TECHNOLOGIES
Relies on ambient air blown over cells. Ineffective under high ambient heat (e.g., Indian summers @ 45°C) and struggles significantly during sustained high-rate DC Fast Charging.
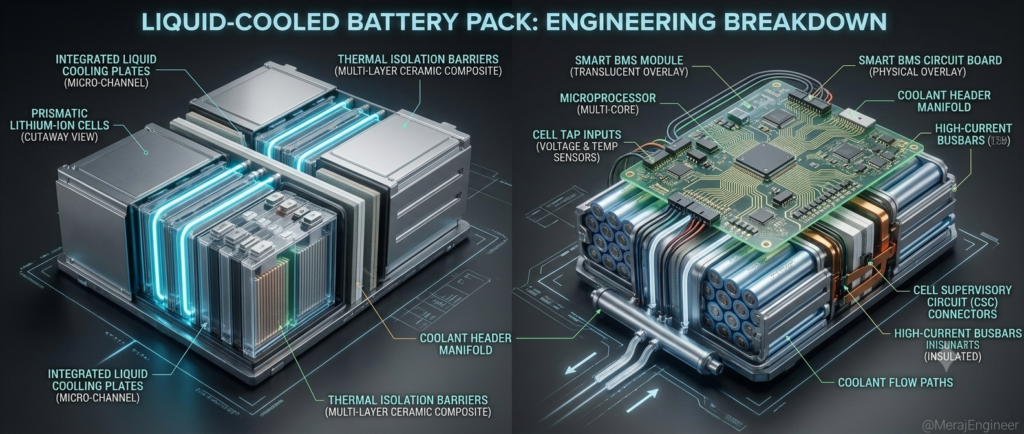
Uses a mixture of water-glycol coolant pumped through aluminum cooling plates sandwiched between battery cells. Efficiently absorbs excess heat during aggressive driving/fast charging and actively warms the battery in extreme cold.
Absorbs high thermal energy during solid-to-liquid phase transitions. Used in cutting-edge pack designs to mitigate localized thermal hot spots without consuming electrical power.
3. Thermal Runaway & Battery Fire Mitigation Mechanics
Thermal runaway occurs when an internal short-circuit, mechanical puncture, or extreme overcharging generates heat faster than it can be dissipated. This triggers an unstoppable exothermic chemical reaction.
Modern Engineering Safeguards Against Thermal Runaway:
THERMAL RUNAWAY PREVENTION & SAFETY LAYERS
Safely releases internal gas pressure before critical thermal swelling or an explosion occurs within individual cells.
Placed between individual cells to act as a fire barrier, preventing dangerous thermal heat transfer from a damaged cell to neighboring healthy cells.
Constantly monitors cell voltages, State of Charge (SoC), and temperatures. If thermal anomalies are detected, pyro-fuses physically disconnect the high-voltage pack within milliseconds.
Mandates smart active BMS, thermal propagation testing, minimum cell-to-cell safety spacing, and IP67 / IP69K water and dust ingress protection ratings.
🛡️ Chapter 4: Active & Passive Safety Systems in Electric Vehicle (Airbags, Battery Enclosures & Crash Mechanics)
Automotive industry me ek common sawal poocha jata hai: “Kya Electric Vehicle unsafe hoti hain unki heavy battery ki wajah se?” Engineering perspective se, EVs ko structured safety ke sath design kiya jata hai jo standard ICE cars se kaafi alag hoti hain.
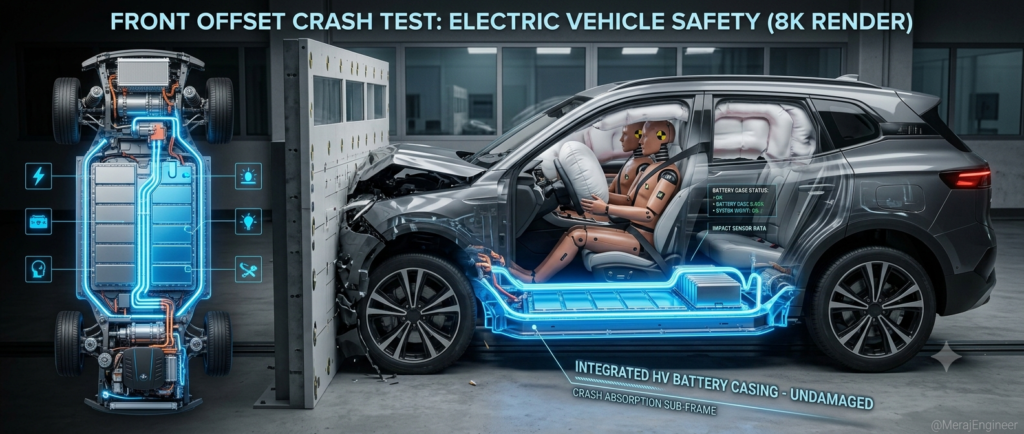
1. Passive Safety: Structural Integrity & Battery Integration
ICE vehicles me front collision ke waqt engine block cabin ki taraf compress ho sakta hai. Lekin Electric Vehicle me front (“Frunk” area) me engine na hone ki wajah se, engineers larger crumple zones design karte hain jo collision energy ko effectively absorb kar lete hain.
EV CHASSIS & CRASH SAFETY ENGINEERING
Modern EVs ko ‘skateboard’ platform par banaya jata hai jahan battery pack chassis ke floorbed par integrated hoti hai. Isse car ka Center of Gravity (CoG) bohot low ho jata hai, jisse high-speed crash ya collision ke dauraan car ke rollover (पलटने) ka risk bohot kam ho jata hai.
EV battery cells ko ultra-high-strength steel ya extruded aluminum cage ke andar sealed pack kiya jata hai. Severe lateral (side-impact) ya vertical impacts ke dauraan, ye protective cage structural rigidity maintain karke cell penetration aur thermal fires ko rokta hai.
2. Airbag Deployment in Electric Vehicle
Bahut se consumers me confusion hoti hai ki Electric Vehicle me airbags hote hain ya nahi.
Haan, EV me airbags exactly standard cars ki tarah hi deploy hote hain.
AIRBAG SAFETY SYSTEM & DEPLOYMENT MECHANISM
EV ke front bumpers, sides aur chassis par high-precision g-force sensors aur accelerometers lage hote hain. Impact detect hote hi, ye sensors milliseconds ke andar Airbag ECU (Electronic Control Unit) ko signal trigger karte hain.
Airbag ECU signal receive karte hi airbag inflator module ko instantly trigger karta hai, jo ek tiny chemical reaction ke through airbag fabric bag ko nitrogen gas se rapid-fill kar deta hai.
Most modern global EVs minimum 6 Airbags (Driver, Passenger, Side, aur Curtain Airbags) ke sath aati hain. Unka operation purely mechanical impact sensing par depend karta hai, na ki vehicle ke electric drivetrain par.
3. High-Voltage Electrical Isolation (Crash-Safe Architecture)
Crash ke dauraan shock lagne ka sabse bada dar rehta hai. Iske liye engineers High-Voltage Disconnect system lagate hain:
PYRO-FUSE INTEGRATION & CURRENT CUTOFF
EVs ke high-voltage loop me pyrotechnic fuses (tiny controlled micro-explosive charges) lage hote hain. Impact detection signal milte hi, ye fuses milliseconds me high-voltage battery connection ko physically severance/cutoff kar dete hain, jisse vehicle ki metallic body me 400V–800V current leak hone ka khatra khatam ho jata hai.
🤖 Chapter 5: Autonomous Driving Systems, ADAS & Autopilot Integration (Engineering Explained)
Bahut log samajhte hain ki EV aur Autopilot (Bina driver ki car) ek hi technology hain. Technically, aisa nahi hai. ADAS (Advanced Driver Assistance Systems) autonomous driving ke levels hain, aur jabki EVs autonomous integration ke liye ideal hain, level-5 autonomous car technically ICE car par bhi banayi ja sakti hai.
1. Understanding ADAS Levels (0 to 5)
ADAS & AUTONOMOUS DRIVING LEVELS MATRIX
| ADAS Level | Classification | Responsibility | Key Features | Engineering Implementation |
|---|---|---|---|---|
| Level 0 | No Automation | Human Driver | Parking Sensors, ABS | Passive warning sensors. No system intervention. |
| Level 1 | Driver Assistance | Human Driver + System | Adaptive Cruise Control, Lane Keep Assist | Either steering OR acceleration/braking is controlled. |
| Level 2 | Partial Automation | System + Human Driver Monitoring | Tesla Autopilot, Traffic Jam Assist | System controls both steering & acceleration. Driver must keep hands on wheel. |
| Level 3 | Conditional Automation | System takes primary control | Eye-off road driving (e.g., Mercedes Drive Pilot) | System monitors environment. Driver must intervene when requested. |
| Level 4 | High Automation | System controls all driving | Robotaxi (Waymo, Cruise) | Geofenced operation. Vehicle stops safely if human fails to intervene. |
| Level 5 | Full Automation | System controls everywhere | No steering wheel, no pedals | Operates everywhere a human can. Full AI and multi-sensor fusion. |
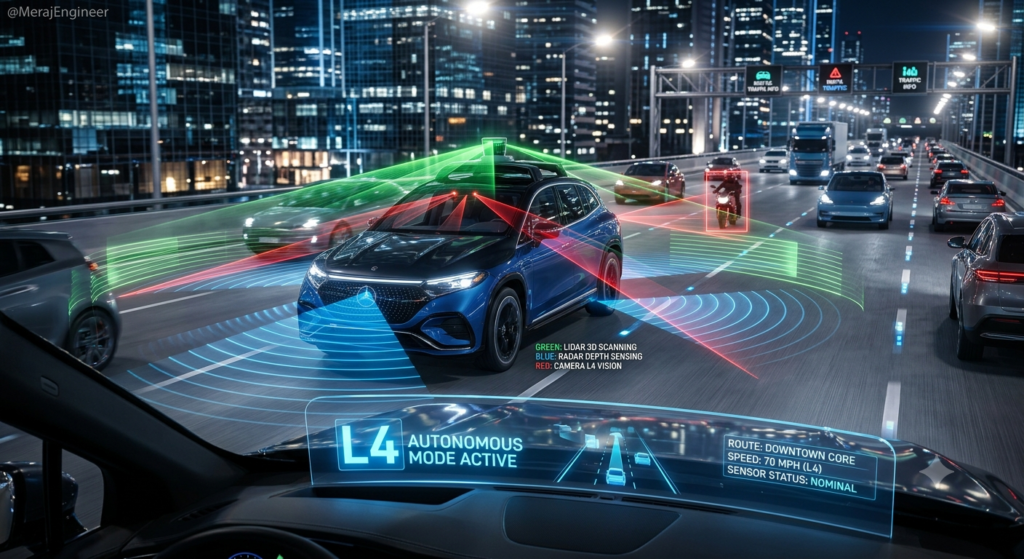
2. Autonomous Sensing Suite: The Eyes of the System
Full autonomous driving system triple-redundant sensors par depend karta hai:
AUTONOMOUS DRIVING SENSOR SUITE
Used for real-time visual perception, including Traffic Lights recognition, Pedestrian detection, Road signs, and Lane markings identification.
Measures exact object distance and relative velocity. Highly reliable under adverse weather conditions including heavy fog, rain, and dust.
Emits pulsed laser beams to build high-resolution 3D point cloud maps, capturing precise 360° environmental spatial geometry.
3. Benefits vs Risks of Autonomous Systems in India
ADAS & AUTONOMOUS DRIVING: BENEFITS VS RISKS
Nearly 94% accidents human error se hote hain (drowsiness, overspeeding, fatigue). AI continuous monitoring karta hai aur fatigue nahi mehsoos karta.
Vehicle-to-Vehicle (V2V Communication) through active traffic density aur braking coordination optimize kar sakta hai.
Level-5 autonomous vehicles visually impaired aur elderly users ke liye safe point-to-point mobility create karengi.
Lane splitting, sudden potholes, stray animals, aur non-standard lane discipline ADAS perception algorithms ke liye severe engineering challenge hain.
Level 3+ ADAS active hone par accident hone par legal responsibility OEM ki hogi ya driver ki? Clear regulatory consensus abhi absent hai.
Remote hacking risk, data privacy concerns, aur sensor spoofing high-voltage connected networks ko risk me daal sakte hain.
Heavy dust, mud, aur extreme monsoon rains me LiDAR lenses aur Camera sensors ki visibility affect ho sakti hai.
📊 Chapter 6: Total Cost of Ownership (TCO) & Comparative Economic Analysis ( Petrol vs Diesel vs Electric Vehicle )
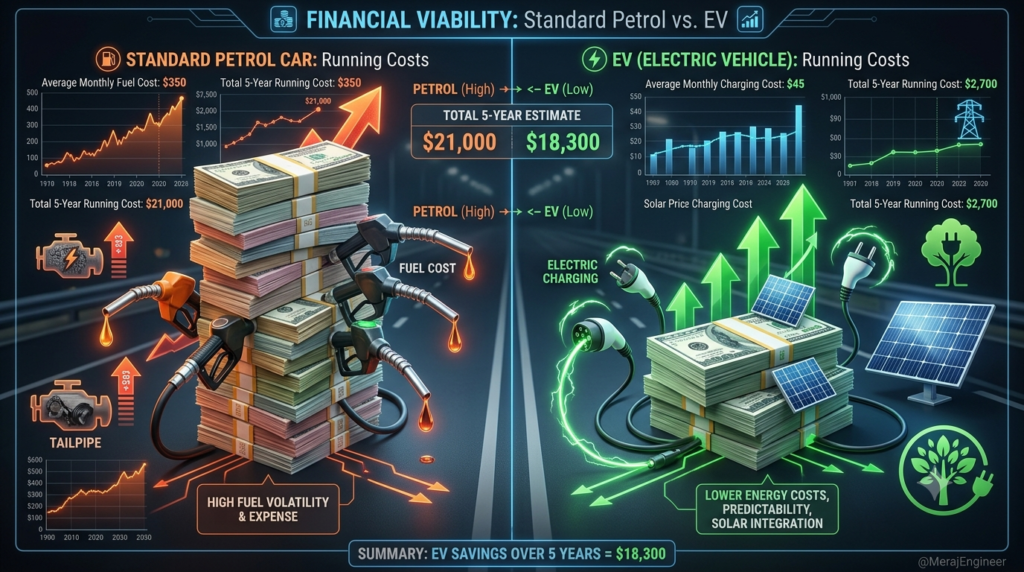
Electric Vehicle khareedna ek financial decision hai. Jabki Electric Vehicle ki Acquisition Cost (shuruaati keemat) ICE car se lagbhag 15% – 25% zyada hai, engineers Total Cost of Ownership (TCO) calculate karte hain long-term financial feasibility ke liye.
1. The Financial Logic: Acquisition vs Running Costs
ICE car initial sasti lagti hai, lekin operational lifetime me wo fuel aur maintenance me heavy kharcha demand karti hai. EV initially expensive hai, lekin operating costs (~₹1 per km) operational savings generate karti hain jo few years me premium break-even kar leti hain.
2. Comparison Master Chart: 5-Year Ownership Analysis
Aayiye 5 saal ke ownership period (Total 60,000 km, ~1,000 km/month) ka breakdown dekhte hain:
TOTAL COST OF OWNERSHIP (TCO): PETROL vs DIESEL vs EV
| Financial Metric | Petrol Car (e.g., Nexon Petrol) | Diesel Car (e.g., Nexon Diesel) | Electric Vehicle (e.g., Nexon EV L.R.) | Engineering Observation |
|---|---|---|---|---|
| Initial On-Road Price | ~₹12,50,000 | ~₹13,80,000 | ~₹17,00,000 | EV carries ~₹4.5L initial battery premium. |
| Fuel / Energy Cost | ₹100 / Liter | ₹90 / Liter | ₹8 / Unit (kWh) | Electricity is dramatically cheaper than fossil fuels. |
| Real-World Efficiency | 14 km/L | 18 km/L | 7.5 km/Unit | Efficiency varies with driving style and ambient temp. |
| Cost Per KM | ₹7.14 / km | ₹5.00 / km | ~₹1.07 / km | EV running cost is 80%+ cheaper. |
| 5-Year Fuel Cost (60,000 km) | ₹4,28,400 | ₹3,00,000 | ~₹64,200 | EV saves ₹3.6 Lakhs in fuel over Petrol! |
| 5-Year Maintenance Cost | ~₹50,000 | ~₹70,000 | ~₹15,000 | EV: Zero engine oil, filters, or spark plug replacements. |
| TCO (Total Cost – 5 Yrs) | ~₹17,28,400 | ~₹17,50,000 | ~₹17,79,200 | After 5 Yrs (60k km), total outlay becomes nearly equal! |
🔑 Financial Engineering Insight (Break-even):
BREAK-EVEN & BUYING RECOMMENDATIONS
Agar aapki running 1,500 km/month ya usse zyada hai, toh EV ka initial price premium fuel savings ke zariye ~3 saal me completely break-even ho jayega.
Agar aapki driving under 500 km/month hai, toh Petrol car apne initial lower upfront cost ki wajah se short-to-medium term me ziada economic option bani rahegi.
Diesel cars NCR aur major metro cities me 10 saal ke strict ban (NGT regulations) ki wajah se severe depreciation aur high resale value risk carry karti hain.
🌍 Chapter 7: Global & Indian Electric Vehicle Industry Ecosystem + Macro-Economic Impact
Electric mobility sirf ek automotive product shift nahi hai; ye ek massive Macro-Economic Transformation hai jo global supply chains, energy geopolitics, aur country-level economies ko redefine kar raha hai.
1. Global Market Hierarchy & Lithium Geopolitics
Duniya bhar me Electric Vehicle industry 3 major continental hubs par tiki hui hai:
GLOBAL EV LANDSCAPE & SUPPLY CHAIN SOVEREIGNTY
Global battery manufacturing capacity ka ~70% to 75% China alone control karta hai. Global industry giants jaise BYD aur CATL world ki largest battery cell suppliers hain. In addition, China lithium, cobalt, aur rare-earth element refining ki 90% global capacity par dominating position rakhta hai.
High-end Software-Defined Vehicles (SDV) architecture, autonomous algorithms, aur nationwide Supercharging infrastructure network ka epicentre. Tesla ne global mass EV adoption ka baseline foundation create kiya hai.
Strict Euro-7 emission norms ke chalte legacy OEMs jaise Volkswagen Group, BMW, aur Mercedes-Benz apne traditional ICE manufacturing facilities ko high-speed automated EV assembly lines me aggressively retrain aur retool kar rahe hain.
GLOBAL & INDIAN EV MARKET SHARE (2026 BENCHMARK)
2. The Indian EV Landscape (Market Status 2026)
India me EV transition fast-pace se aage badh raha hai. Passenger vehicles me Tata Motors (~39% market share) lead kar raha hai (Harrier.ev, Nexon.ev, Curvv.ev, Punch.ev), jabki Mahindra (~23%) aur JSW MG Motor (~21%) strong competition de rahe hain. Maruti Suzuki aur VinFast ne bhi market penetration increase kiya hai.
DOMESTIC EV ADOPTION DRIVERS & POLICY INITIATIVES
Industry pioneers jaise Ola Electric, TVS (iQube), Ather Energy, aur Bajaj (Chetak) India ke 2-wheeler segment ke 60%+ electric transition ko aggressively lead kar rahe hain, jo country ke overall EV volumes ka largest driver hai.
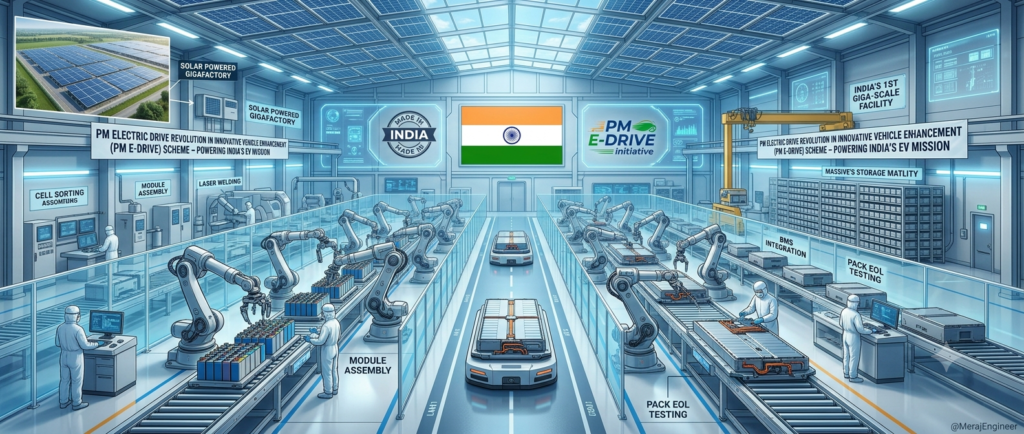
Central Government ki flagship PM E-DRIVE Scheme (₹10,900 Crore Outlay) ne direct buyer demand incentives, commercial e-buses, e-trucks, aur nationwide public charging infrastructure rollout ko massive policy momentum diya hai.
3. Economic Impact: Benefits vs Structural Challenges
MACRO-ECONOMIC IMPACT & INFRASTRUCTURE CHALLENGES
India lagbhag 85% Crude Oil import karta hai. Mass EV adoption se foreign exchange reserves protect hote hain aur national trade deficit significantly kam hota hai.
PLI (Production Linked Incentive) scheme ke under domestic battery cell Gigafactories (ACC) set up ho rahi hain, jisse high-tech engineering aur R&D jobs create ho rahi hain.
Metro cities me zero tailpipe emissions (NOx, PM2.5, Carbon Monoxide) hone se public healthcare burden drastically reduce hota hai.
Millions of EVs agar same Peak Hours (evening 7 PM – 10 PM) par charge honi shuru ho jayein, toh DISCOMs ke local transformers overload ho sakte hain. Iske liye Smart Grid & V2G (Vehicle-to-Grid) deployment zaroori hai.
Critical mineral refining (Lithium, Cobalt, Nickel) me foreign supply chain dominance economic vulnerabilities maintain karta hai.
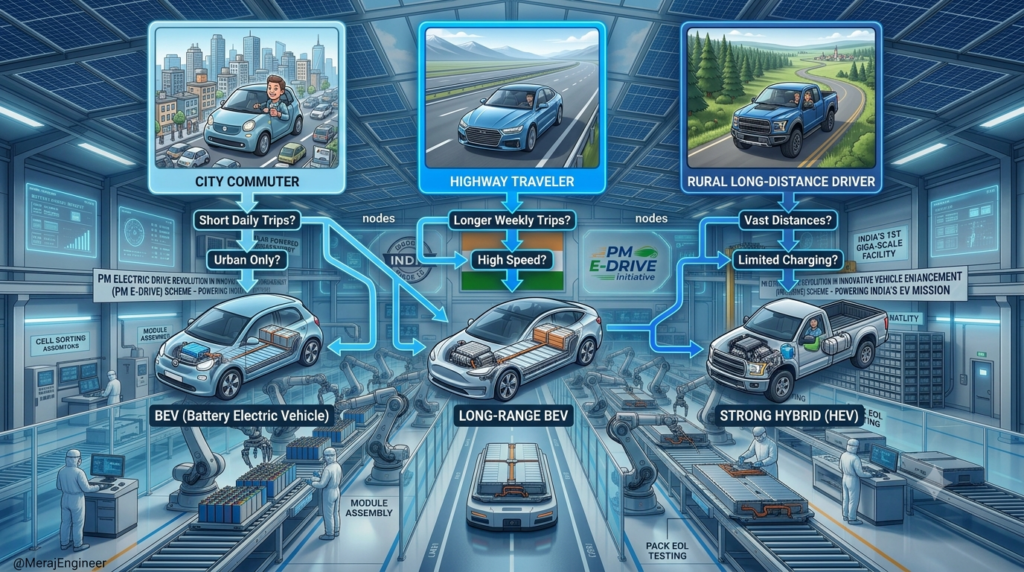
🎯 Chapter 8: Consumer Buying Framework – Kis Insan Ko Konsa Vehicle Lena Chahiye?
Galat vehicle tech choose karne se financial aur operational loss ho sakta hai. Ye engineering-backed decision matrix reader ko unke specific usage pattern ke hisab se right vehicle select karne me madad karega:
CONSUMER DECISION TREE MATRIX
1. Persona Profile 1: Daily City Commuter (20 km to 60 km Daily)
1. URBAN / CITY COMMUTER PROFILE
Daily office commute, city market runs, and school drop-offs. Peak speed remains under 70 km/h in stop-and-go traffic.
Pure BEV (Electric Scooter / Compact EV Car).
Overnight Home AC Slow Charging (15A Socket) se vehicle daily 100% ready milegi, eliminates dependence on public fast chargers. Running cost is practically negligible (~₹1/km vs Petrol ₹7.5/km).
Ather 450X, Ola S1, Tata Tiago.ev / Punch.ev, MG Windsor EV.
2. Persona Profile 2: High-Mileage Highway Commuter (80 km to 180 km Daily)
2. HIGH MILEAGE / INTERSTATE COMMUTER PROFILE
Inter-city daily travel (e.g., Delhi–Gurgaon–Noida, Mumbai–Pune route) and commercial sales representatives with daily high-distance running.
Long-Range BEV (40 kWh – 60 kWh Battery Pack).
Monthly fuel bill Petrol/Diesel me ₹20,000–₹30,000 tak pohoch jata hai. Long-range EV me ye energy cost sirf ₹3,000–₹4,000 aayegi. High monthly driving distance me car ki monthly EMI ki cost fuel savings se fully recover ho jati hai.
Tata Nexon.ev LR / Harrier.ev, Mahindra XUV400 / BE series, Hyundai Creta EV / MG ZS EV.
3. Persona Profile 3: Frequent Unplanned Long-Distance Traveler (500+ km in a single day)
3. REMOTE / RURAL & UNPREDICTABLE ROUTE PROFILE
Traveling to remote tier-3 towns, rural areas, or unpredictable cross-country routes on a weekly basis.
Hybrid Electric Vehicle (HEV / PHEV) ya High-Efficiency Petrol.
Remote highways aur rural belts par Fast DC Charging network ki density abhi developing phase me hai. Battery charging queue delays aur range anxiety long-distance travel time ko drastically badha sakti hain.
🛠️ Chapter 9: Regulatory Compliance, Safety Standards & Legal Disclaimer
1. Indian Automotive Industry Standards (AIS)
India me Electric Vehicles ko strict government testing protocols ke under certify kiya jata hai:
MANDATORY INDIAN REGULATORY SAFETY STANDARDS
Electric 2-Wheelers aur 3-Wheelers ke battery packs ke liye mandatory thermal safety, thermal propagation prevention, IP67 dust/waterproof ingress protection, aur smart BMS monitoring standard.
Electric 4-Wheelers (M & N categories) ke high-voltage electrical safety, crash protection, aur mechanical impact resistance test requirements.
⚠️ LEGAL DISCLAIMER (अस्वीकरण)
Disclaimer: Is comprehensive guide me provide ki gayi tamaam technical, electrochemical, financial, aur market metrics authoritative automotive industry research reports (jaise International Energy Agency – IEA, BloombergNEF, Ministry of Heavy Industries – MHI, MoRTH Vahan Dashboard Data, aur certified OEM technical datasheets) par base deep engineering analysis ke baad compile ki gayi hain. Is content ka uddeshya sirf educational awareness, engineering clarity, aur consumer guidance provide karna hai. Battery chemical degradation rates, state-wise electricity tariffs, government subsidy policies (jaise PM E-DRIVE), aur vehicle market prices dynamic hoti hain aur time ke sath change ho sakti hain. Author ya Website is jankari ke aadhar par liye gaye kisi bhi individual financial, legal, ya purchasing decision ki kisi bhi tarah ki koi bhi zimmewari (liability) nahi leta. Kisi bhi vehicle purchase se pehle official manufacturer specifications aur dealership documentation ko independently verify zaroor karein.
THANK YOU FOR READING!
Aashayein hain ki is detailed engineering aur market guide se aapko Indian EV Ecosystem, Battery Safety Norms, aur EV Buying Options ke baare me complete clarity mili hogi. Humara lakshya aapko verified research and unbiased data ke saath sahi mobility decision lene me help karna hai.